Analytics Module: Revenue By Source Overview
Last modified on:
Overview
The Analytics Module enables businesses to track statistical information across multiple areas within the RezExpert system. "Analytics - Revenue By Source" specifically tracks statistical information related to reservation revenue and/or occupant revenue according to Reservation Source.
Prerequisites
- Access to the RezExpert system.
- Necessary permissions to view the Analytics module.
Steps
Location
- Click any Menu button.
- Click on the Analytics tab.
- Select Analytics - Revenue By Source in the Analytics section.
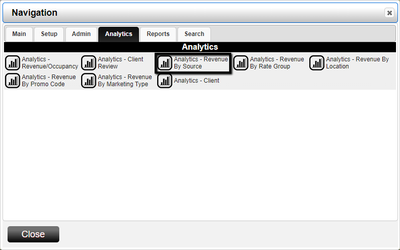
Overview
- The Overview Tab contains chart-based analytic information.
- The table at the top of the panel displays figures related to various types of information for a particular month.

- Occupancy: Percentage of available units occupied. (Occ # divided by Avail #)
- Total Rev: Amount of revenue (reservation charges) charged.
- ADR: Average Daily Revenue. (Total Revenue divided by Occ #)
- Rev PAR: Revenue per available room. (Total Revenue divided by Avail #)
- Avg Length of Stay: Average length of time for reservations made.
- Avail Unit Days: Total number of Units available for the days selected. (# of units X # of days)
- Total Rez Days: Number of days reservations were made for, within the searched date range.
- Total # Rez: Total number of reservations made.
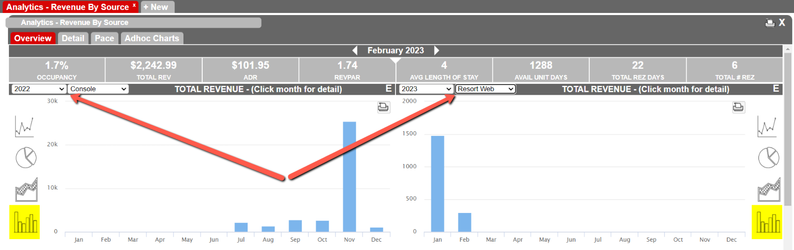
- Use the drop-downs to select the Year and Source you wish to view.
- Two panels are available side by side for data comparison.
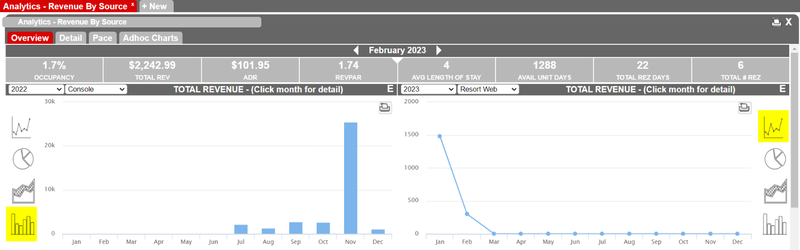
- View information in different chart styles: bar charts, pie charts, line charts, and area charts.
- Charts are interactive for detailed information.
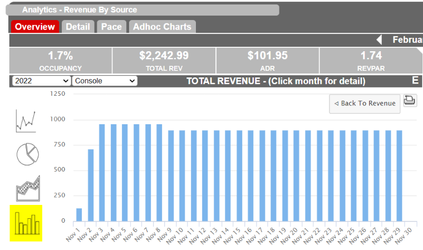
- Below the Total Revenue charts, load other charts for Total Rev, Total # Rez, Total Rez Days, and Avg Length Of Stay.
Detail
- The Detail tab loads the Source revenue information for viewing statistics for all Reservation Sources over a selected date range.
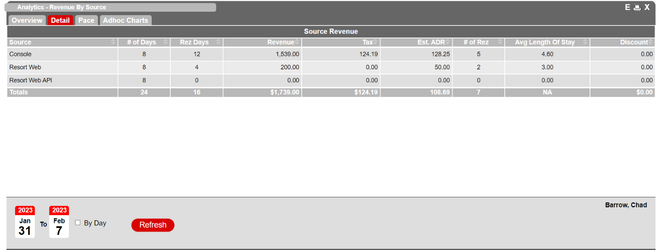
Definitions of Columns
- # of Days: Number of days within the searched date range.
- Rez Days: Number of days reservations were made for, within the searched date range.
- Revenue: Amount of revenue (reservation charges) charged.
- Tax: Amount of Tax on charges.
- Est. ADR: Estimated Average Daily Revenue. (Total Revenue divided by Occ #)
- # of Rez: Total number of reservations made.
- Avg Length of Stay: Average length of time for reservations made.
- Discount: Amount of money discounted.
Pace
- The Pace tab loads the Source Revenue information for comparative statistics based on selected date ranges.
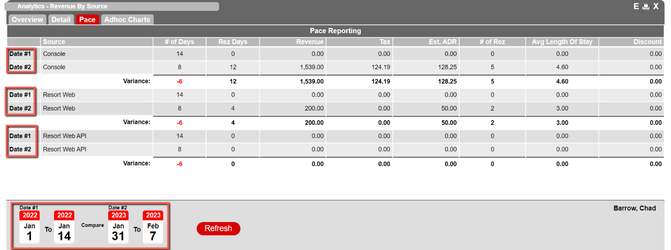
- Date #1: Information for the first selected date.
- Date #2: Information for the second selected date.
- Variance: Calculated difference between the two units.
Adhoc Charts
- The Adhoc tab is currently not available.
Troubleshooting
- Ensure you have the necessary permissions to access the Analytics module.
- Verify that the selected date ranges and sources are correct for the data you wish to view.